Portfolio
Narrative Chart

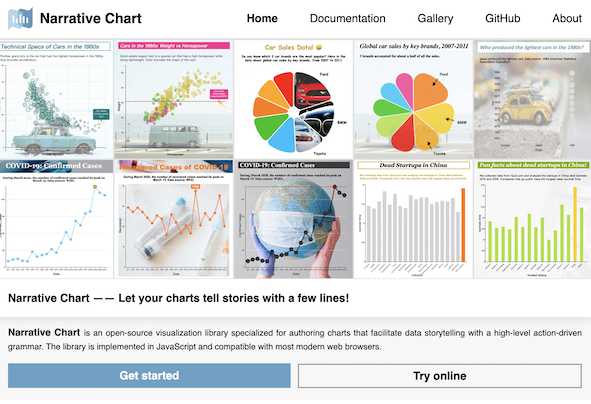
Narrative Chart is an open-source visualization library specialized for authoring charts that facilitate data storytelling with a high-level action-driven grammar. The library is implemented in JavaScript and compatible with most modern web browsers.
纳图是由同济大学智能大数据可视化实验室设计开发的一款专门用于支持“叙事图表”创作的数据可视化图表库。与已有的图表库相比,Narrative Chart 将可视化的创作过程分解成独立的设计行为,并实现了数据标注、动效、装饰等一系列核心操作。利用 Narrative Chart ,开发者、设计师、分析师,甚至是有作图需求的大众用户,都可以通过直观易懂的语法创作出丰富的图表效果。
Calliope

Calliope is a visual data story generation platform that employs advanced AI techniques to automatically analyze data and represent data insights in the form of narrative visualization.
Calliope 是一款由同济大学智能大数据可视化实验室研发的智能数据可视化内容生成平台,可以帮助用户快速生成、创建、编辑和分享各种形式的数据可视化内容。用户只需拖拽上传数据,即可自动生成相应的可视化内容。平台提供了多种可视化图表及排版方式,适用于各种应用场合,轻轻一点即可将所生成的可视化内容分享给好友或合作方。
