Page Not Found
Page not found. Your pixels are in another canvas.
A list of all the posts and pages found on the site. For you robots out there is an XML version available for digesting as well.
Page not found. Your pixels are in another canvas.
About me
This is a page not in th emain menu
Published:
This post will show up by default. To disable scheduling of future posts, edit config.yml and set future: false.
Published:
This is a sample blog post. Lorem ipsum I can’t remember the rest of lorem ipsum and don’t have an internet connection right now. Testing testing testing this blog post. Blog posts are cool.
Published:
This is a sample blog post. Lorem ipsum I can’t remember the rest of lorem ipsum and don’t have an internet connection right now. Testing testing testing this blog post. Blog posts are cool.
Published:
This is a sample blog post. Lorem ipsum I can’t remember the rest of lorem ipsum and don’t have an internet connection right now. Testing testing testing this blog post. Blog posts are cool.
Published:
This is a sample blog post. Lorem ipsum I can’t remember the rest of lorem ipsum and don’t have an internet connection right now. Testing testing testing this blog post. Blog posts are cool.
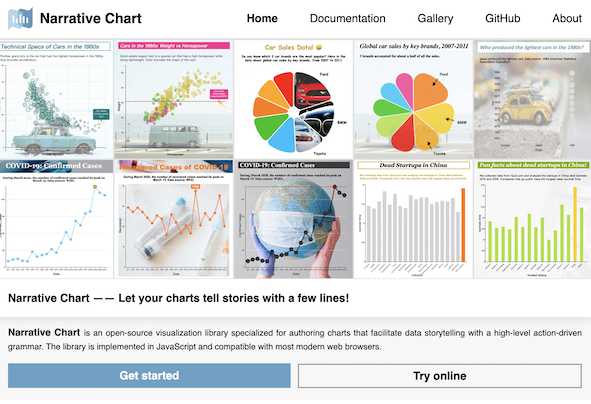
Narrative Chart is an open-source visualization library specialized for authoring charts that facilitate data storytelling with a high-level action-driven grammar. The library is implemented in JavaScript and compatible with most modern web browsers. 
Calliope is a visual data story generation platform that employs advanced AI techniques to automatically analyze data and represent data insights in the form of narrative visualization. 
IJCNN2020, 2020
Recommended citation: Yi K, Guo Y, Fan Y, et al. Cosmo vae: Variational autoencoder for cmb image inpainting[C]//2020 International Joint Conference on Neural Networks (IJCNN). IEEE, 2020: 1-7. https://arxiv.org/pdf/2001.11651.pdf
ACM Transactions on Interactive Intelligent Systems, 2021
Recommended citation: Guo Y, Shi D, Guo M, et al. Talk2Data: A Natural Language Interface for Exploratory Visual Analysis via Question Decomposition[J]. arXiv e-prints, 2021: arXiv: 2107.14420. https://arxiv.org/pdf/2107.14420.pdf
IEEE Transactions on Visualization and Computer Graphics , 2021
Recommended citation: Guo Y, Guo S, Jin Z, et al. Survey on visual analysis of event sequence data[J]. IEEE Transactions on Visualization and Computer Graphics, 2021, 28(12): 5091-5112. https://arxiv.org/pdf/2006.14291.pdf
Applied Science, 2022
Recommended citation: Guo Y, Cao N, Cai L, et al. Datamator: An Authoring Tool for Creating Datamations via Data Query Decomposition[J]. Applied Sciences, 2023, 13(17): 9709. https://arxiv.org/pdf/2304.03126.pdf
IEEE Transactions on Visualization and Computer Graphics, 2023
Recommended citation: Chen Q, Chen Y, Shuai W, et al. Chart2Vec: A Universal Embedding of Context-Aware Visualizations[J]. arXiv preprint arXiv:2306.08304, 2023. https://arxiv.org/pdf/2306.08304.pdf
IEEE Human Machine Systems (Under Review), 2023
Recommended citation: Guo Y, Cao N, Qi X, et al. Urania: Visualizing Data Analysis Pipelines for Natural Language-Based Data Exploration[J]. arXiv preprint arXiv:2306.07760, 2023. https://arxiv.org/pdf/2306.07760.pdf
Published:
Undergraduate course, University 1, Department, 2014
Short description of portfolio item number 1
Workshop, University 1, Department, 2015
This is a description of a teaching experience. You can use markdown like any other post.